Introduction
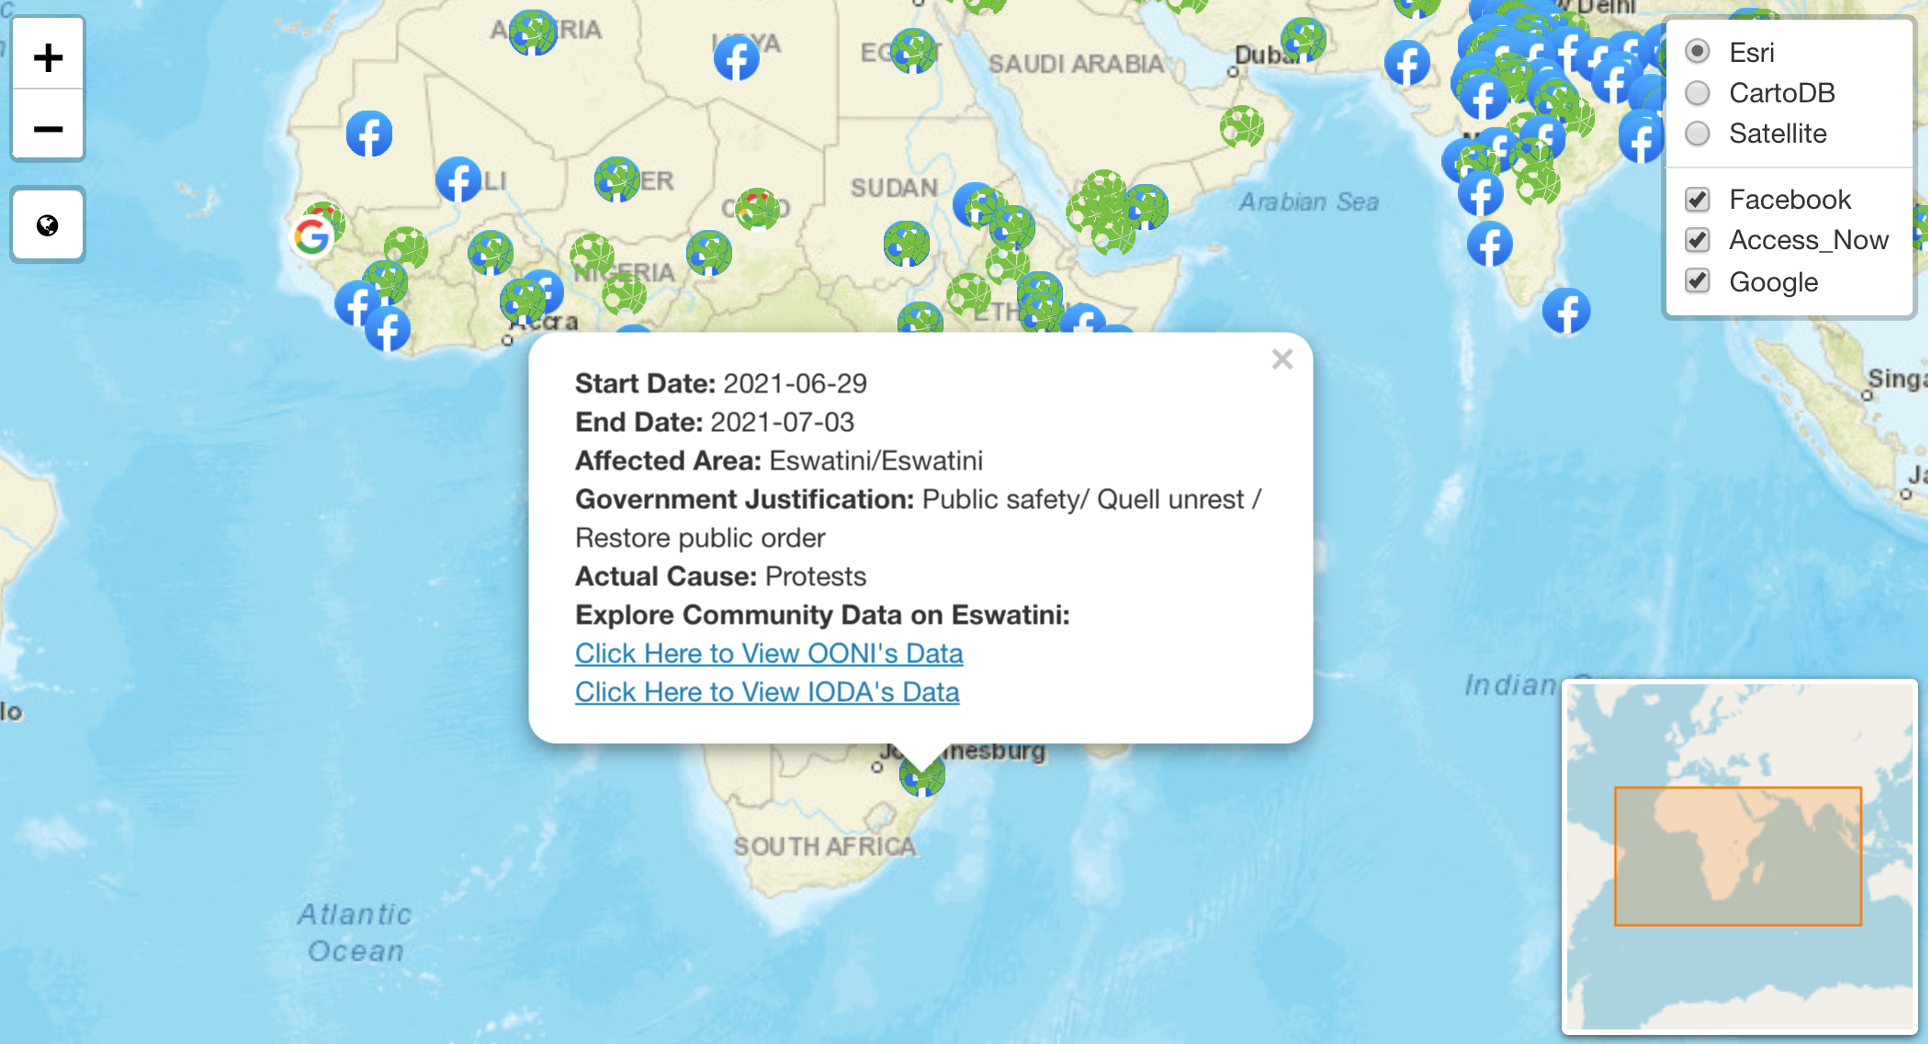
The “GLITCH Dashboard” is an interactive tool that enables users to explore data on information controls in a novel way. The USP of the dashboard is the granularity of the data presented and that it brings together data on internet shutdowns and political-related event data such as protests and riots.
Data
The internet measurement data comes from Access Now’s STOP Database, Meta’s data on Internet Disruptions, and Google’s data on Traffic and Disruptions.
The political event data come from Integrated Crisis Early Warning System (ICEWS)’s Coded Event data. The dashboard currently filters for Conflict and Mediation Event Observations (CAMEO) Code; 145 (Protest violently, riot, not specified);
1451 (Engage in violent protest for leadership change); 1452 (Engage in violent protest for policy change); 1453 (Engage in violent protest for rights); and 1454 (Engage in violent protest for change in institutions, regime).
The dashboard also links shutdown events to external data from the Open Observatory of Network Interference (OONI) and the Internet Outage Detection and Analysis (IODA)[1] based on the country and start/end dates. This enables the user to cross-reference data and explore shutdowns using various metrics.
Methodology
Access Now’s data collection methodology uses both qualitative and quantitative methods. While some internet shutdowns are confirmed through technical measurement, others rely on contextual information, such as news reports or personal accounts. A full description of Access Now’s methodology can be found on their website.
ICEWS data collection methodology uses a “mixed methods approach to instability forecasting, combining heterogeneous statistical and agent-based models in an integration framework with an aggregate forecast accuracy of more than 80 percent”.[2]
The dashboard was built in R using Leaflet and RShiny. This project is ongoing and reasonable efforts have been made to ensure the accuracy of the data.
Conclusion
The “GLITCH Dashboard” highlights the value of triangulating data on shutdowns and including data surrounding protests and riots, which are often reported as a cause of an internet shutdown. Please note that the GLITCH dashboard is one of many within the community. Those looking to explore other internet shutdown dashboards may want to visit SFLC’s Internet Shutdown Tracker or Internet Society’s Pulse. Alternatively, data on censorship or internet traffic can be explored through OONI or IODA‘s dashboards.