In 2023, the GLITCH Research Interest Group released two tools.
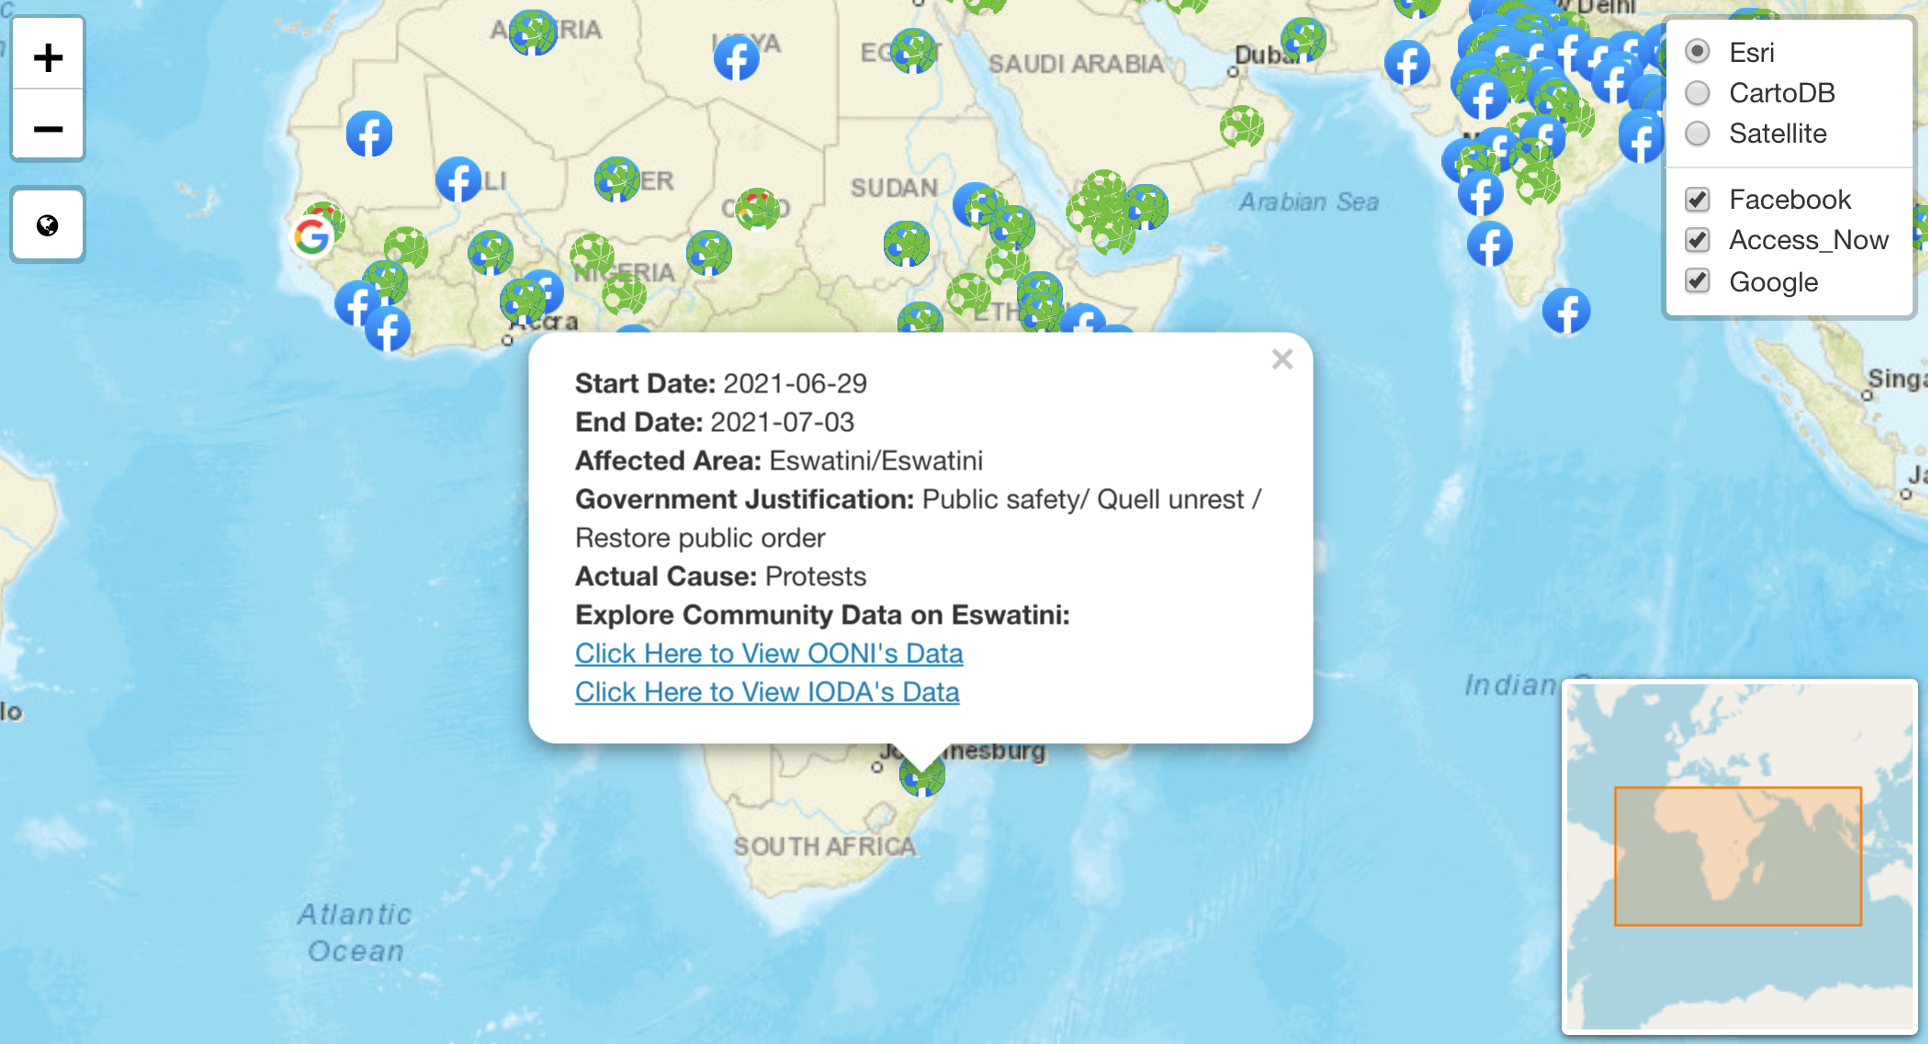
The first is an interactive world map that enables users to explore data on information controls in a novel way. The USP of the dashboard is the granularity of the data presented, and that it brings together data on internet shutdowns and politcal related event data such as protests and riots.
The second is a tracker that uses computational methods to indentify anomalies in Tor usage. The tracker’s approach identifies contiguous anomalous periods, rather than daily spikes or drops, and allows anomalies to be ranked according to deviation from expected behaviour. The detection tool has been in developemnet since August 2016, and is in use by a number of individuals, academics, and NGOs as an early warning system for potential censorship events.
For details, please visit the News page.