
Introduction
Internet shutdowns have been recorded as early as 2007. However, the study of shutdowns through computational methods is in its infancy. With recent developments in computational power, the resources needed to apply certain methods have been drastically reduced, making them more accessible to researchers. One example is scholarly network analysis. To our knowledge, this blog is the first bibliometric analysis of shutdown literature and has two primary goals. First, to inspire others to apply computational methods to explore shutdowns from unique perspectives. Second, to provide a basic mapping of shutdowns literature to assist those looking to understand the scholastic landscape better.
Methods
This blog uses the R package, ‘bibliometrix’. Bibliometrix is an “open-source tool for quantitative research in scientometrics and bibliometrics”[1]. In addition to Bibliometrix, other tools, such as VOSviewer, Gephi, BibExcel, or Leximancer, could be helpful if you wish to conduct bibliographic analysis on topics such as shutdowns, surveillance, disinformation, or content moderation. Other tools, such as Open Knowledge Maps or Connected Papers, could also be interesting to query when first exploring the topic of shutdowns.
As described by N. Donthu et al. (2021)[2], there are several parts to the bibliometric toolbox, such as performance analysis, science mapping and enrichment techniques. This blog focusses on science mapping and will provide information such as the most influential publications and authors. This analysis roughly follows the recommended bibliometrix’s Science Mapping Workflow.
Data
The data used in this analysis merges bibliographic data from Web of Science, Scopus, Lens, and Dimensions. Querying multiple sources and then merging and removing duplicate entries should provide a more comprehensive overview than relying on a single database. However, despite these efforts, any scholarly database may have inaccuracies, and as such, there are limitations to conclusions drawn from this analysis. For simplicity and given the illustrative purposes this blog aims to serve, only “internet shutdown” was queried. However, there are a wide range of terms that future analysis can include, including but not limited to; Internet, Platform, Shutdown, Blanket, Total, Partial, Blackout, Kill-Switch, Virtual Curfew, Outage, Throttling, Slowdown, Disruption, Interference, Government-Imposed/Led, or Censorship. When querying “internet shutdowns” across the four databases, a total of 532 documents were collected, with 120 duplicates removed.
Results & Discussion
1. Descriptives
As shown in Figure 1, there has been a drastic increase in documents focussed on internet shutdowns.[3]. When we include data on the rising number of recorded shutdowns since 2007, we see that the increase in documents focussed on shutdowns followed. Note the drop in shutdowns since Covid-19 and their slow increase again. Oxford Analytica (2022) have commented on this trend stating, “internet shutdowns are returning to pre-pandemic levels across all major developing regions“. [4]
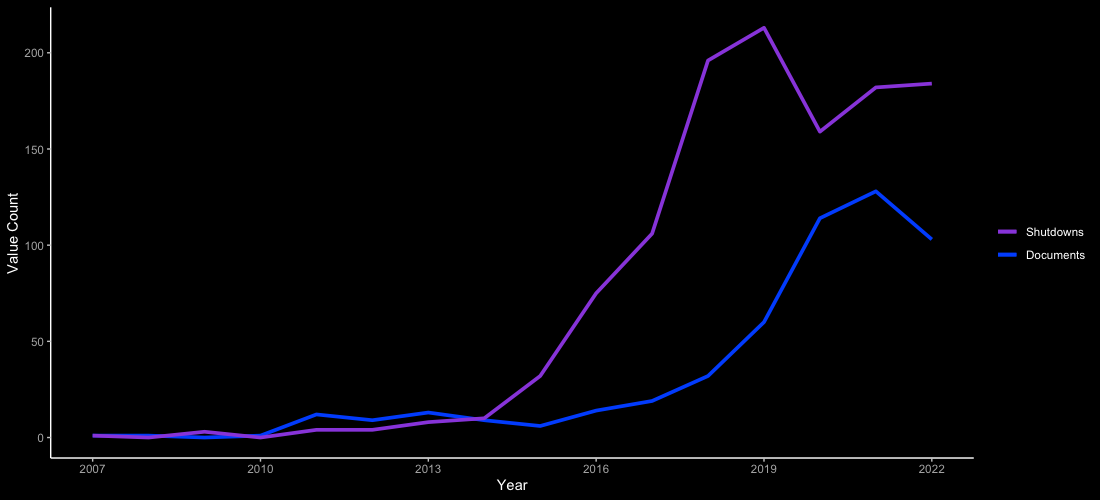
Figure 1: Shutdown and Shutdown Document Count, 2007-2022
Based on the documents produced and cited, we identified a few of the most productive researchers. Here they are listed with an ISIC Group suggested reading from each author.[5]
1. Ayalew, Y – The Internet Shutdown Muzzle(s) Freedom of Expression in Ethiopia: Competing Narratives, 2020
2. De Gregorio, G – Internet Shutdowns and the Limits of Law, 2020, co-authored with Stremlau
3. Deibert, R – Reset: Reclaiming the Internet for Civil Society, 2020
4. Ensafi, R – Censored planet: An internet-wide, longitudinal censorship observatory, 2020, co-authored with Sundara Raman, Shenoy, & Kohls
5. Feldstein, S – The Rise of Digital Repression, 2021
6. Freyburg, T – Blocking the Bottleneck: Internet Shutdowns and Ownership at Election Times in Sub-Saharan Africa, 2018, co-authored with Garbe
7. Moinuddin, S – Digital Shutdowns and Social Media, 2021
8. Mpofu, S – His Excellency, the Internet and Outraged Citizens, 2022
9. Parks, L – The Slow Shutdown: Information and Internet Regulation in Tanzania From 2010 to 2018 and Impacts on Online Content Creators, 2020
10. Stremlau, N – The Changing Landscape of Internet Shutdown in Africa, 2020, co-authored with Marchant
As seen in Figure 2, many of the top productive authors started publishing shutdown-related research in the years 2017-2020. Given the data shows Deibert as one of the earliest producers of shutdown research, it is worth highlighting some of their achievements. If you are interested in learning more about this author, you may want to explore books they have co-edited, such as Access Denied, Access Controlled, and Access Contests. Additionally, visiting The Citizen Lab (founded and currently directed by Deibert) could support your research in this field, given they regularly produce reports on information controls.
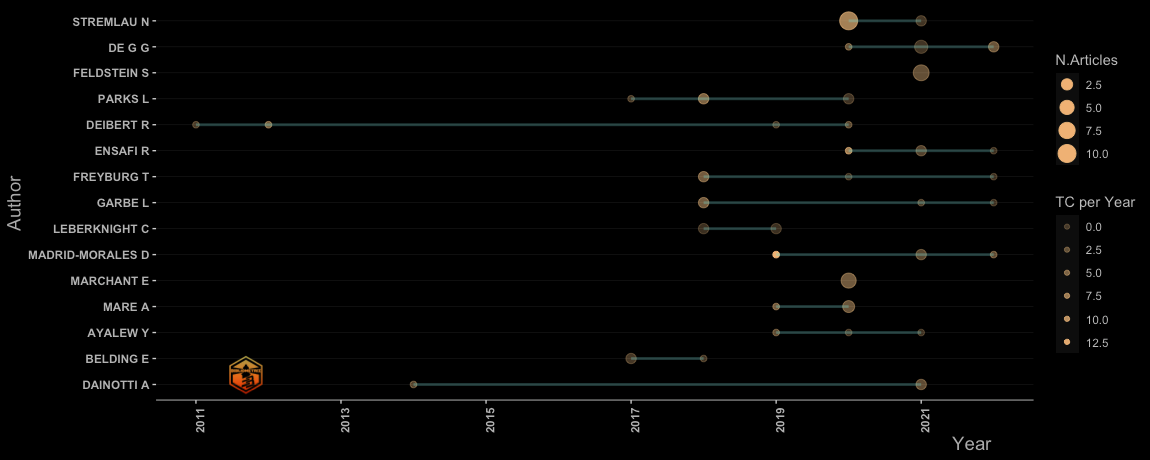
Figure 2: Top Author’s Production Over Time
Key statistics about the documents are:
– Annual Growth Rate: 39%
– Average Document Age: 2.5 years
– Average Citations Per Document: 7.6
– Average Citations Per Year Per Document: 1.9
Some of the most relevant sources were:
1. ACM International Conference Proceeding Series
2. African Journalism Studies
3. Information, Communication & Society
4. International Journal of Communication
5. Proceedings of the ACM Internet Measurement Conference
Some of the top manuscripts by citations were:
1. Alhelou, HH – A Survey on Power System Blackout and Cascading Events: Research Motivations and Challenges, 2019
2. Budd, J – Digital technologies in the public-health response to COVID-19, 2020
3. Chesney, B – Deep Fakes: A Looming Challenge for Privacy , 2019
4. De’ R – Impact of digital surge during Covid-19 pandemic: A viewpoint on research and practice, 2020
5. DeNardis, L – Hidden levers of Internet control, 2012
6. DeNardis, L – The Global War for Internet Governance, 2014
7. Dinniss, HH – Cyber Warfare and the Laws of War, 2012
8. Goyal, K – Fear of COVID 2019: First suicidal case in India !, 2020
9. Klausen, J – Tweeting the Jihad: Social Media Networks of Western Foreign Fighters in Syria and Iraq, 2014
10. Quan, L – Trinocular: Understanding Internet Reliability Through Adaptive Probing, 2013
Based on the scraped documents, some of the most relevant keywords you may wish to include in your own research queries are:
1. Africa
2. Cameroon
3. Censorship
4. Covid-19
5. Democracy
6. Human Rights
7. India
8. Internet
9. Internet Shutdown
10. Network Security
11. Social Media
12. Social Networking
2. Co-Citation Analysis
Figure 3[6] shows the co-citation network for key documents in the shutdown scholarship. The below co-citation network visualises essential research that internet shutdown publications are co-citing. It is valuable to understand the authors, conceptual frameworks, and seminal works on which the academic field of shutdowns is being built. Co-cited documents are often semantically similar.
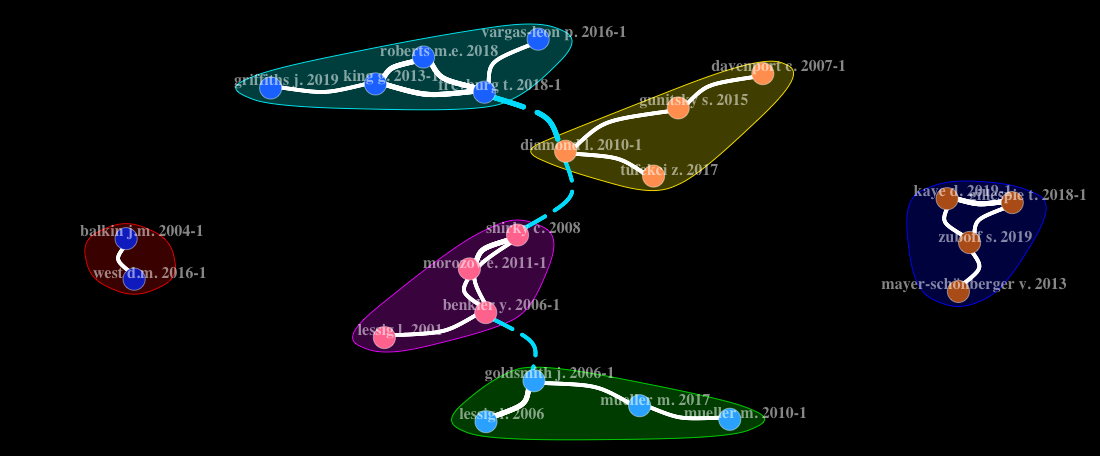
Figure 3: Co-Citation Network
If you are interested in further readings, the works visualised above are:
Balkin (2004) – Digital Speech and Democratic Culture: a Theory of Freedom of Expression for the Information Society
Benkler (2006) – The Wealth of Networks: How Social Production Transforms Markets and Freedom
Davenport (2007) – State Repression and Political Order
Diamond (2010) – Liberation Technology
Freyburg (2018) – Blocking the Bottleneck: Internet Shutdowns and Ownership at Election Times in Sub-Saharan Africa
Gillespie (2018) – Custodians of the Internet: Platforms, Content Moderation, and the Hidden Decisions That Shape Social Media
Goldsmith (2006) – Who Controls the Internet?: Illusions of a Borderless World
Griffiths (2019) – The Great Firewall of China How to Build and Control an Alternative Version of the Internet
Gunitsky (2015) – Corrupting the Cyber-Commons: Social Media as a Tool of Autocratic Stability
Kaye (2019) – Speech Police The Global Struggle to Govern the Internet
King (2013) – How Censorship in China Allows Government Criticism but Silences Collective Expression
Lessig (2006) – Code, and Other Laws of Cyberspace
Mayer-Shonberger (2013) – Big Data: A Revolution That Will Transform How We Live, Work, and Think
Morozov (2011) – The Net Delusion: The Dark Side of Internet Freedom
Mueller (2010) – Networks and states: The global politics of Internet governance. Information revolution and global politics
Mueller (2017) – Will the Internet Fragment? Sovereignty, Globalization and Cyberspace
Roberts (2018) – Censored: Distraction and Diversion inside China’s Great Firewall
Shirky (2008) – Here Comes Everybody: The Power of Organizing Without Organizations
Tufekei (2017) – Twitter and Tear Gas: The Power and Fragility of Networked Protest
Vargas-Leon (2016) – Addressing the ultimate form of cyber security control: a multiple case study for the Internet kill switch
West (2016) – Internet Shutdowns Cost Countries $2.4 Billion Last Year
Zuboff (2019) – Surveillance Capitalism and the Challenge of Collective Action
3. Co-Word Analysis
Figure 4[7] shows co-word analysis using keyword co-occurrences. The graph below highlights the terms shutdown literature use in a single document. For example, keyword pairs such as “Internet” and “Technological Development” or “Cryptography” and “Security Analysis” are often used together. Co-words, like co-citation, may indicate semantic similarity.
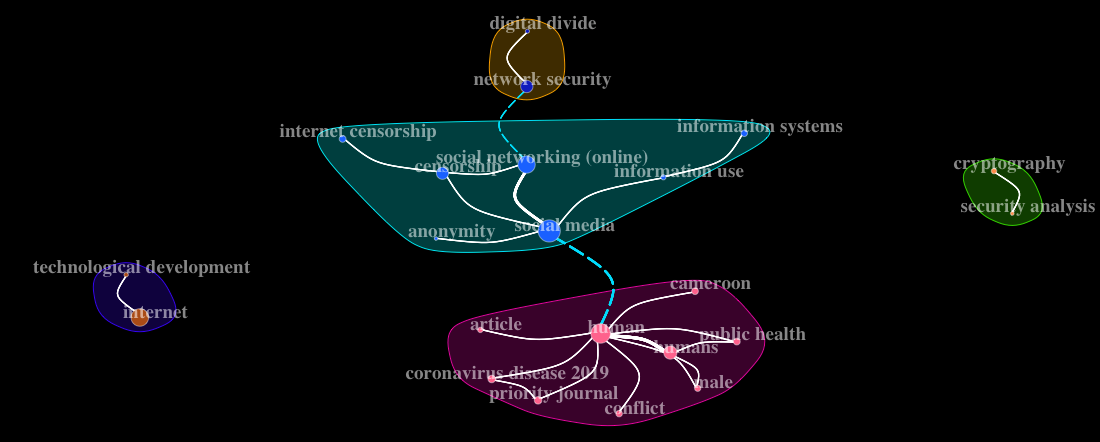
Figure 4: Keyword Co-Occurrences
Some netwok communities are larger than others, for example, “Human” with “Conflict” or “Public Health”, and “Social Media” with “Anonymity”, “Censorship” or Social Networking (Online”). While Figure 4 shows the whole landscape, Figure 5 below shows how the top co-word occurrences have changed over time. By splitting the data into subsets for 2007-2016 and 2017-2022, we see which new terms started being used as new researchers entered the field from 2017 onwards.
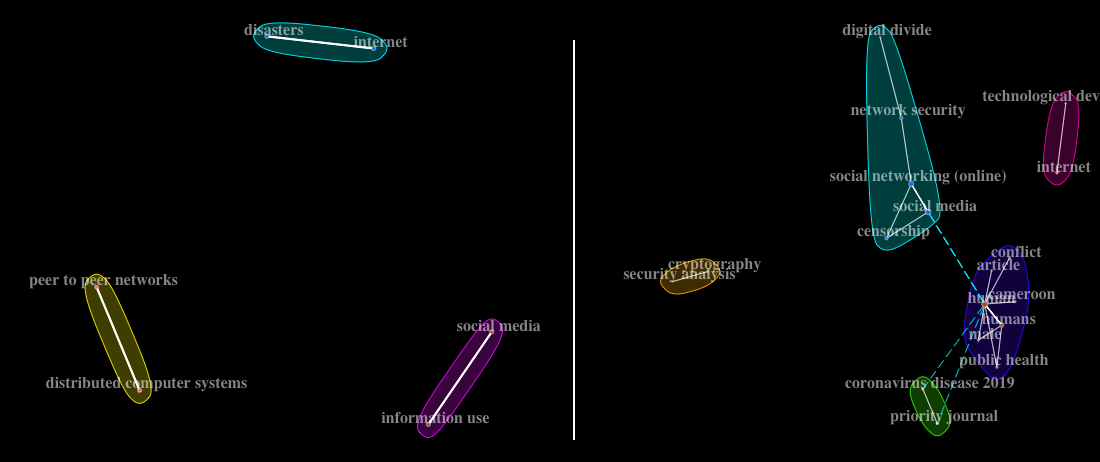
Figure 5: Keyword Co-Occurrences, Left (2007-2016), Right (2017-2022)
Figure 5 shows that in the early years of shutdown research (2007-2016), keyword co-occurrences of “Peer to Peer Networks” and “Distributed Computer Systems”, “Social Media” and “Information Use”, and “Disasters” and “Internet”, were the most common. However, in more recent years (2017-2022), other leading terms have emerged, such as “Cryptography”, “Security Analysis”, and “Coronavirus Disease 2019”. In addition, some network communities, for example, those around “Social Media”, have developed to now include co-word occurrences with “Social Networking (Online)”, “Censorship”, “Network Security”, and “Digital Divide”.
4. Thematic Map
Figure 6 visualises a thematic map of shutdown literature. The graph below shows the conceptual structure of the field and consists of four quadrants or themes, 1) Motor, 2) Basic, 3) Emerging or Declining, and 4) Niche.
1. Motor themes (upper-right) are well developed and important for structuring a research field. They have high density and high centrality.
2. Niche themes (upper-left) are highly developed and isolated, meaning they have limited importance for the field. They have high density and low centrality.
3. Emerging or Declining Themes (lower-left) are weakly developed and marginal. They have low density and low centrality.
4. Basic Themes (lower-right) are highly relevant but less developed within a field. They have low density and high centrality.[8]
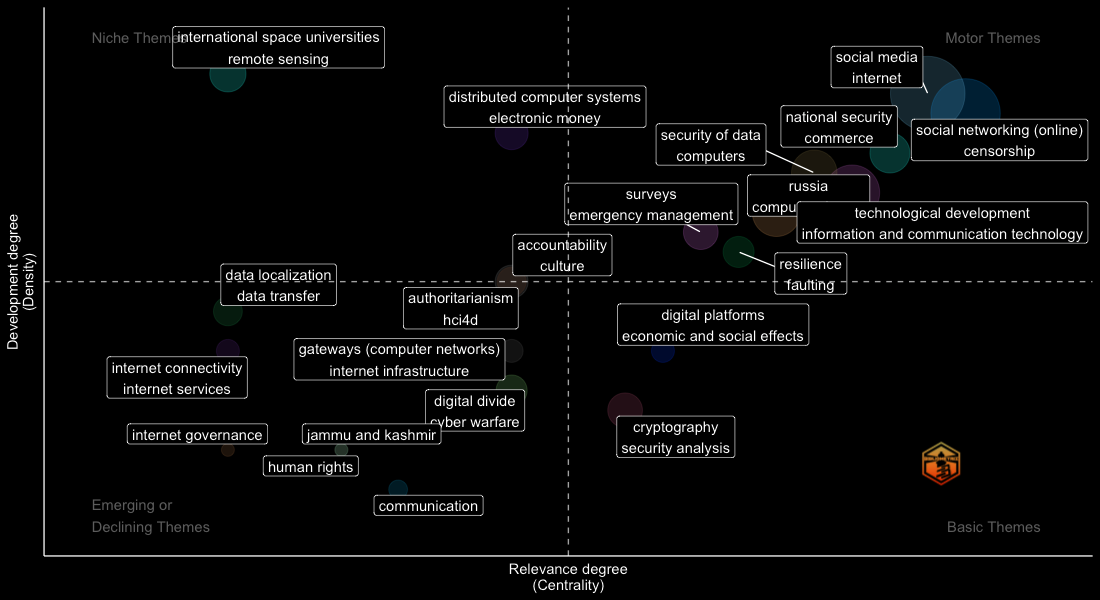
Figure 6: Thematic Map
While Figure 6 shows the whole landscape, Figure 7 below shows how the themes within shutdown literature have changed over time. We see which new themes emerged in recent years by splitting the data into subsets for 2007-2016 and 2017-2022. Some terms, such as “Social Media” or “Censorship”, have significantly developed into the motor quadrant and are now quite important to the field. Other themes, such as “International Space Universities” and “Remote Sensing”, have emerged as niche themes within the literature, specifically as they relate to the importance of satellites for the internet and potential risks, such as solar flares or the Kessler syndrome. Lastly, some themes which are important yet underdeveloped include the “digital divide”, “political geography,” and “sustainable development”.
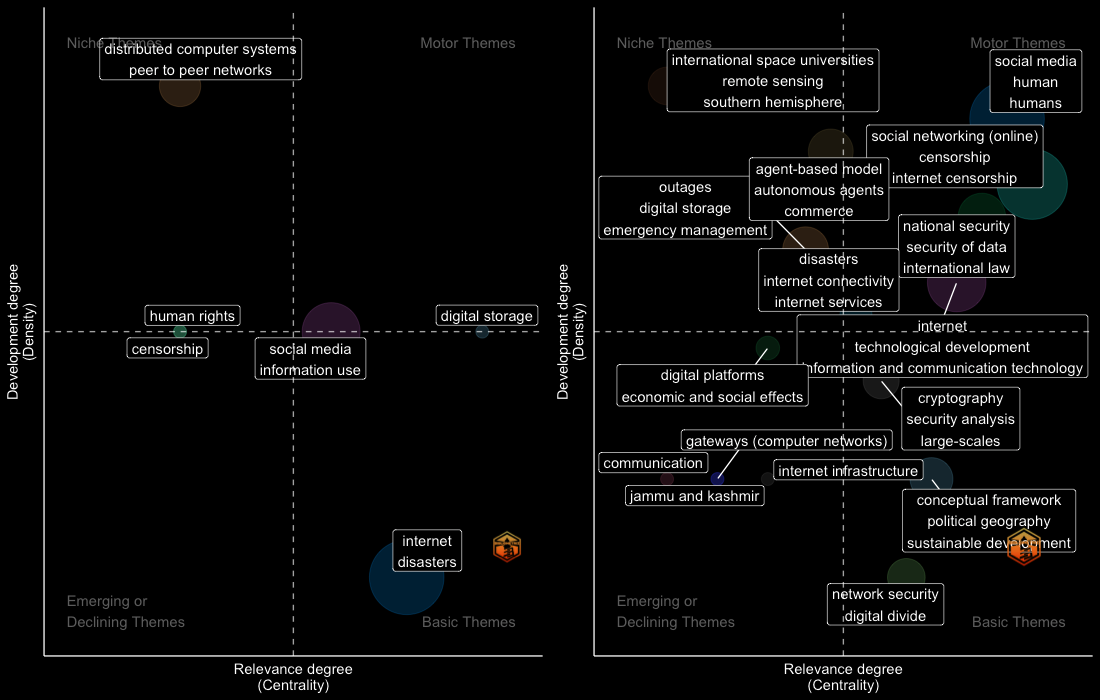
Figure 7: Thematic Map, Left (2007-2016), Right (2017-2022)
5. Collaboration Analysis
Figure 8 shows collaboration for some of the most influential authors.[9] Some collaborations seem to be based on university affiliations, for example the connection between De Gregorio & Stremlau (University of Oxford), Garbe & Freyburg (University of St Gallen), or Xue, Jain, Sundara Raman, and Ensafi (University of Michigan). Other collaborations seem to be present due to the underlying nature of a paper (e.g., more multidisciplinary, or international). For example, the largest community seen in Figure 8, near the bottom, is due to the Covid-19 paper from Budd et al. (2020) which has 17 co-authors and was published in Nature Medicine.
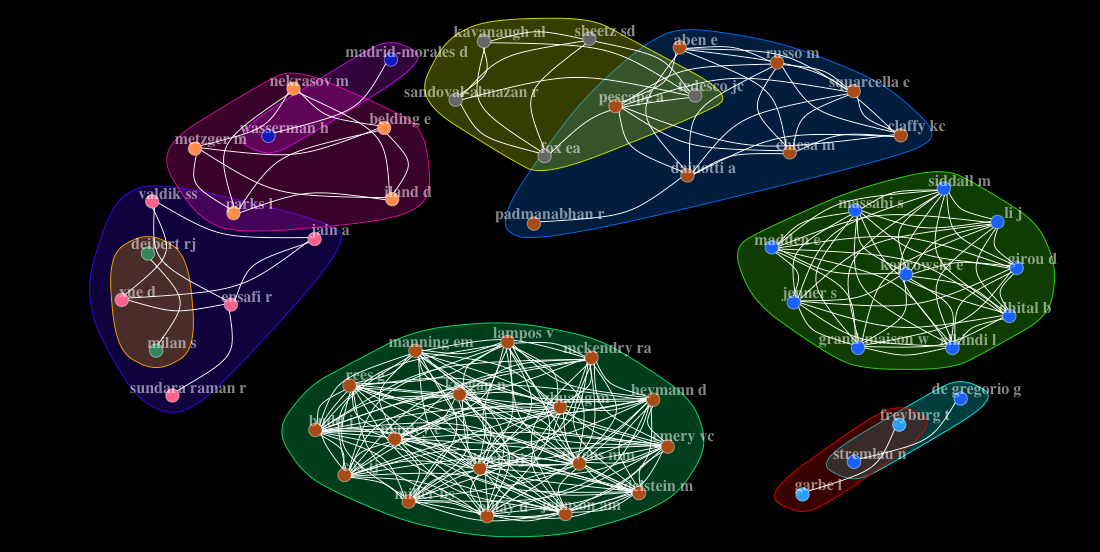
Figure 8: Author Collaboration
Figure 9 shows collaboration for some of the most influential countries in terms of research output. In terms of country collaboration, in decreasing order, the USA, UK, Switzerland, Australia, Canda, South Africa, and Germany are the top countries.
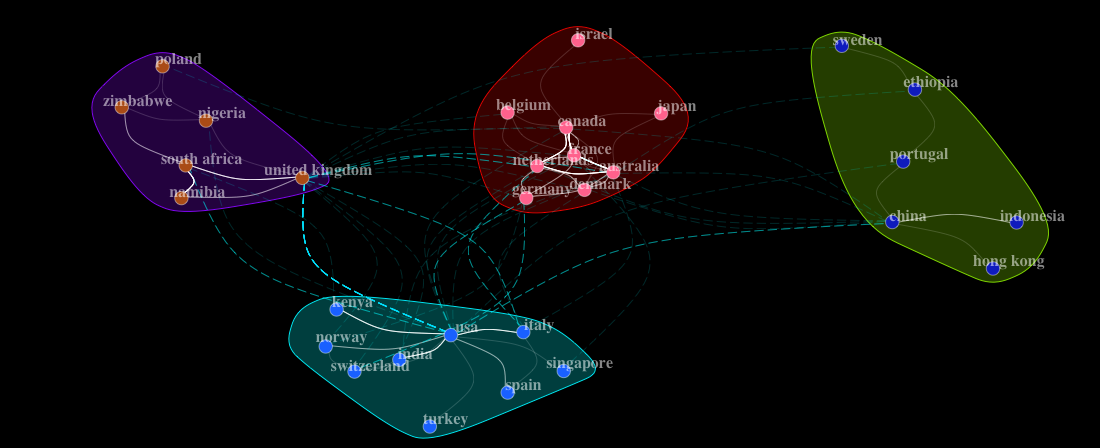
Figure 9: Country Collaboration
Conclusion
This blog conducted a computational bibliometric analysis of shutdown literature and provided a basic mapping of shutdown literature. This blog highlighted historical, thematic, and collaborative elements of the shutdown field. For example, 2017, 2018 and 2019 saw a significant increase in the number of researchers publishing on internet shutdowns. Some themes, such as “social media”, have become well developed, new niche themes, such as “remote sensing”, have emerged, and others, such as “political geography”, are important yet underdeveloped and may merit further research. In terms of collaboration, these seem to be partly based on university affiliations and in cases where this is less strong, collaborations happen due to larger multidisciplinary or international projects, for example, studies on COVID-19. Given the complexities of shutdowns, greater efforts to contextualise them are needed. More collaboration between institutions publishing on shutdowns and institutions geographically located in countries where shutdowns happen may yield more robust findings. Given this blog is likely the first bibliometric analysis of internet shutdown literature, it has been novel in its findings and methodological application. With new literature being released annually, the ISIC group may look run year by year analysis of shutdown research to explore the nuances of yearly events or increase the scope to include other terms such as “censorship” and explore how “shutdowns” fit into the broader literature within the context of bibliometrics.